6–12 hour response windows
By the time a fermentation issue shows up in reports, it can already be cascading into distillation—lost corn, lost ethanol, and fouled equipment.
Industries / Ethanol
AI-powered monitoring and analytics built for ethanol producers. Detect fermentation anomalies faster, eliminate manual data analysis, and stop failures before they cascade to distillation.
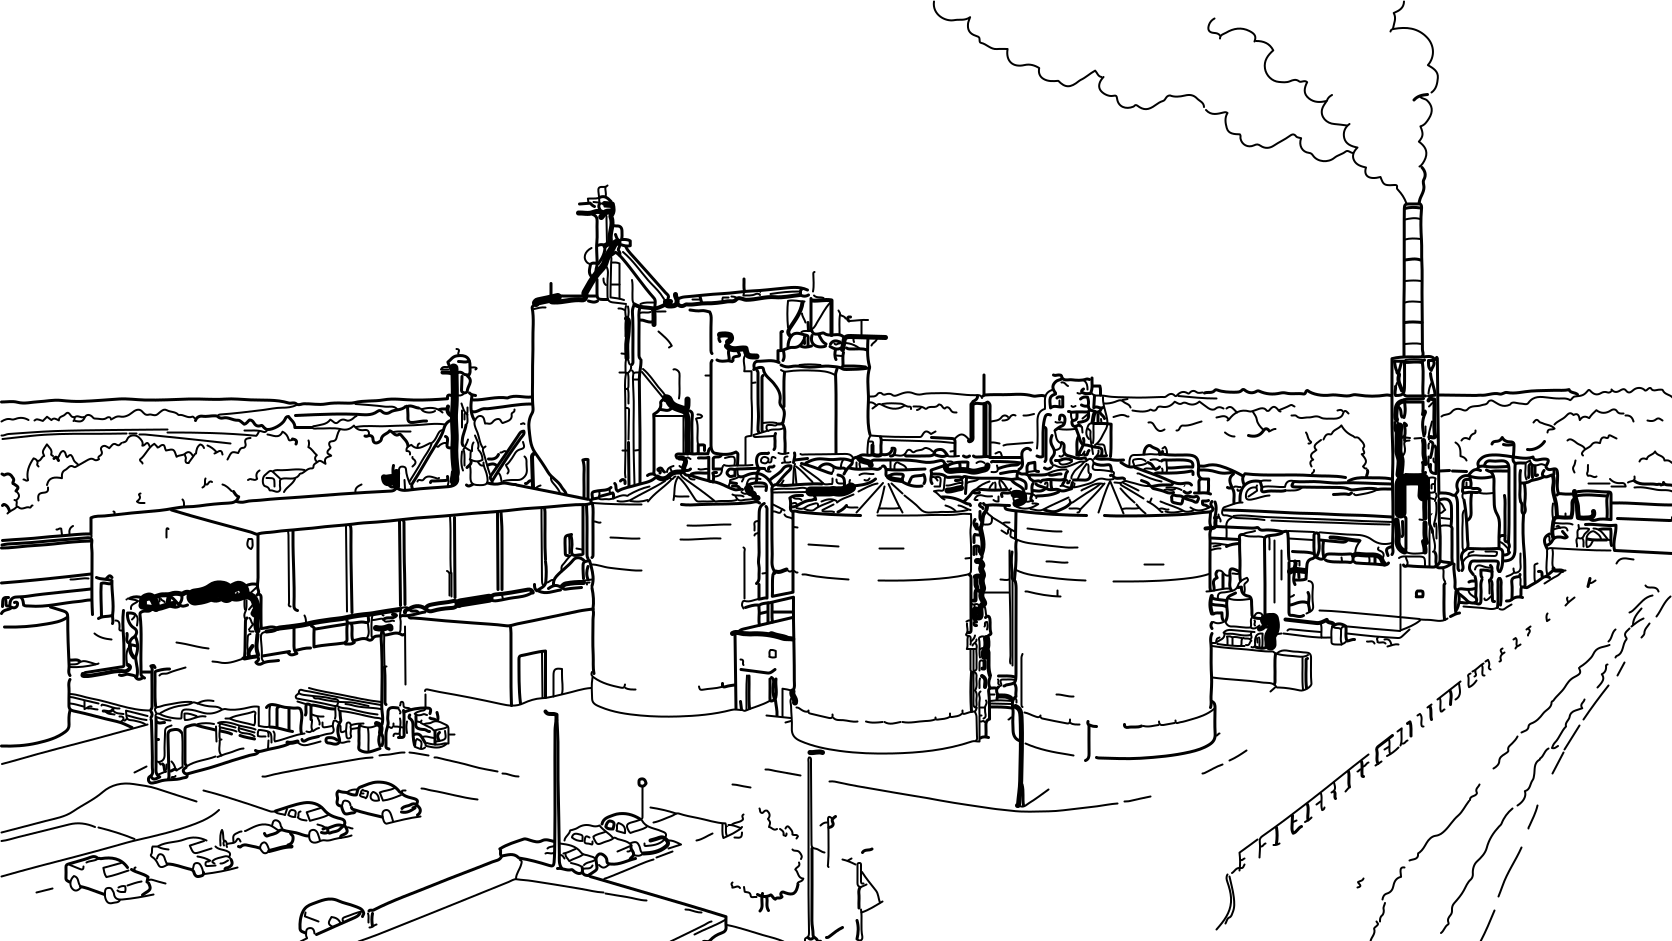
Connected plant data. Earlier insight.
6–12h
Average industry detection delay
<1h
Anomaly alert time with Rimba
$100k+
Average cost of a fermentation failure
90%
Reduction in manual data processing time
The problem
Ethanol production leaves little room for error, yet many plants still rely on manual spreadsheets, reactive troubleshooting, and hours-old data.
By the time a fermentation issue shows up in reports, it can already be cascading into distillation—lost corn, lost ethanol, and fouled equipment.
Data arrives by email as inconsistently formatted spreadsheets. Manually compiled reports are difficult to analyze at scale across tanks and facilities.
Skilled teams spend their time parsing data to find what went wrong, instead of preventing problems before they affect production.
The cost of delay
An illustrative failure timeline shows how delayed detection can turn a fermentation issue into a production emergency.
Yeast stress or contamination starts affecting conversion rates.
Undetected
Off-spec beer is heading toward the distillation column.
Still invisible
An operator sends a spreadsheet to the technical team by email.
Emergency response
Hours of manual analysis are needed before a recommendation is possible.
Damage accumulates
Input costs, equipment fouling, and lost yield have already incurred significant costs.
Delayed action
The Rimba solution
Connect SCADA, DCS, email reports, and lab results with continuous AI monitoring, so your team can act on clear operational insights.
Connect directly to Ignition, Allen Bradley, Siemens, and other control systems. Sensor-level data flows continuously, rather than in eight-hour email batches.
Continuous plant data integration
How it works
Connect to your data, understand it, detect anomalies, and deliver clear guidance to your team.
Step / 01
SCADA, DCS, lab results, and email reports
Step / 02
AI document and sensor data ingestion
Step / 03
Continuous analysis of patterns and deviations
Step / 04
Live KPIs, trend views, and actionable alerts
Real-world impact
The most expensive failures start small: a CO₂ curve that drifts, or a temperature creeping up. Give your team context to recognize and respond to these changes earlier.
Monitor every tank around the clock—CO₂ evolution, brix and gravity, temperature, and pH—to build a live picture of each batch from pitch to transfer.
Illustrative monitoring view
Anomaly detected · Gravity stall at T+16h
Similar patterns appeared in three prior batches. The alert brings historical context to the technical team for review.